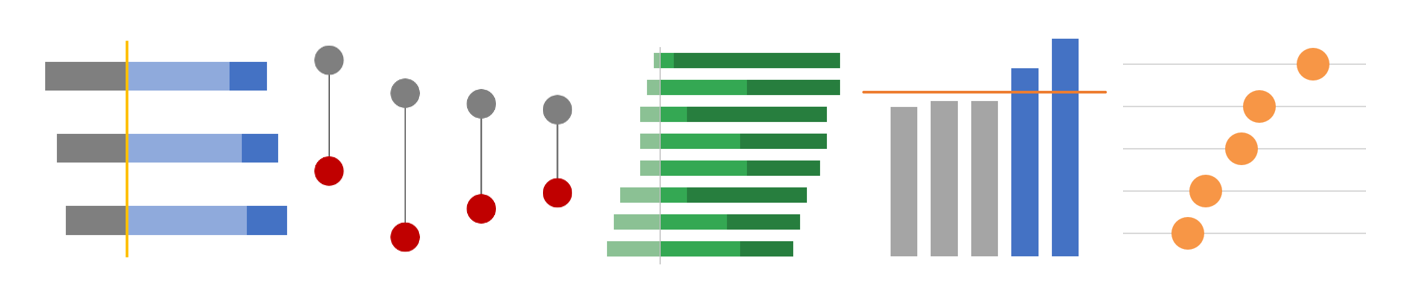
An effective data visualization or display can attract interest, communicate your findings, and inspire action. REDI can support your organization with informative charts, graphs, or GIS maps that make it easier to see and understand trends and patterns within a large amount of data.
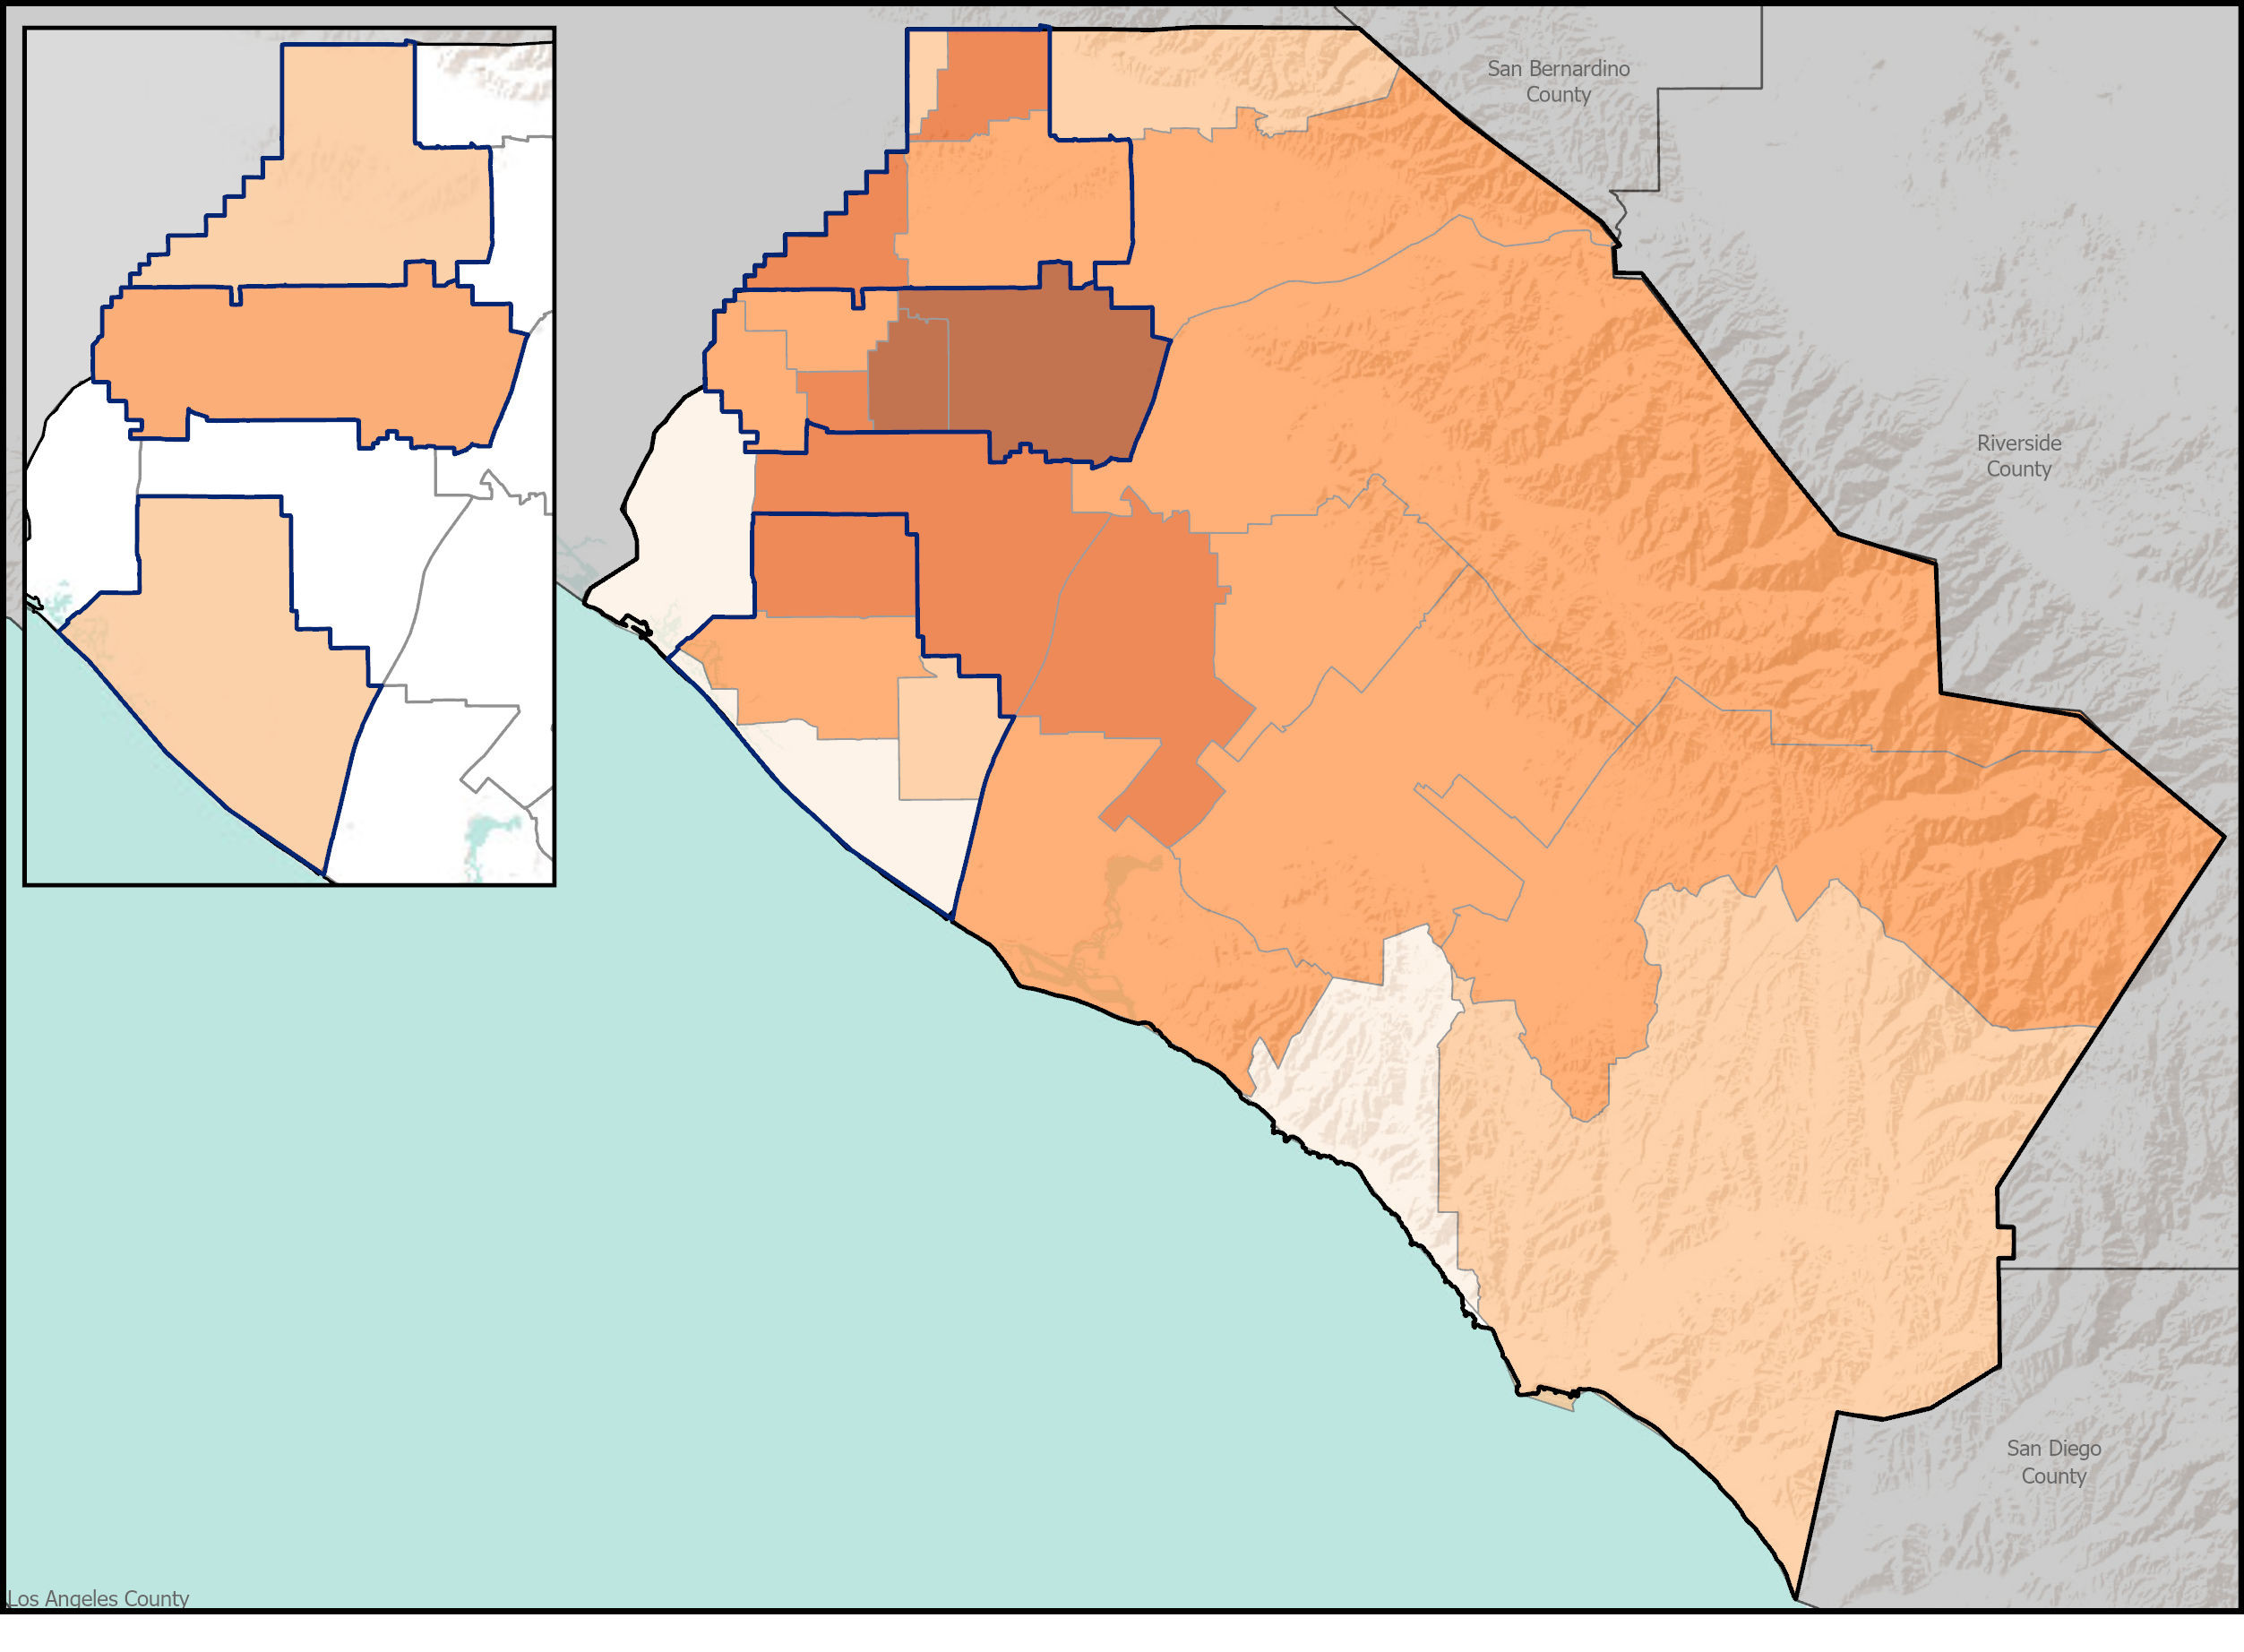
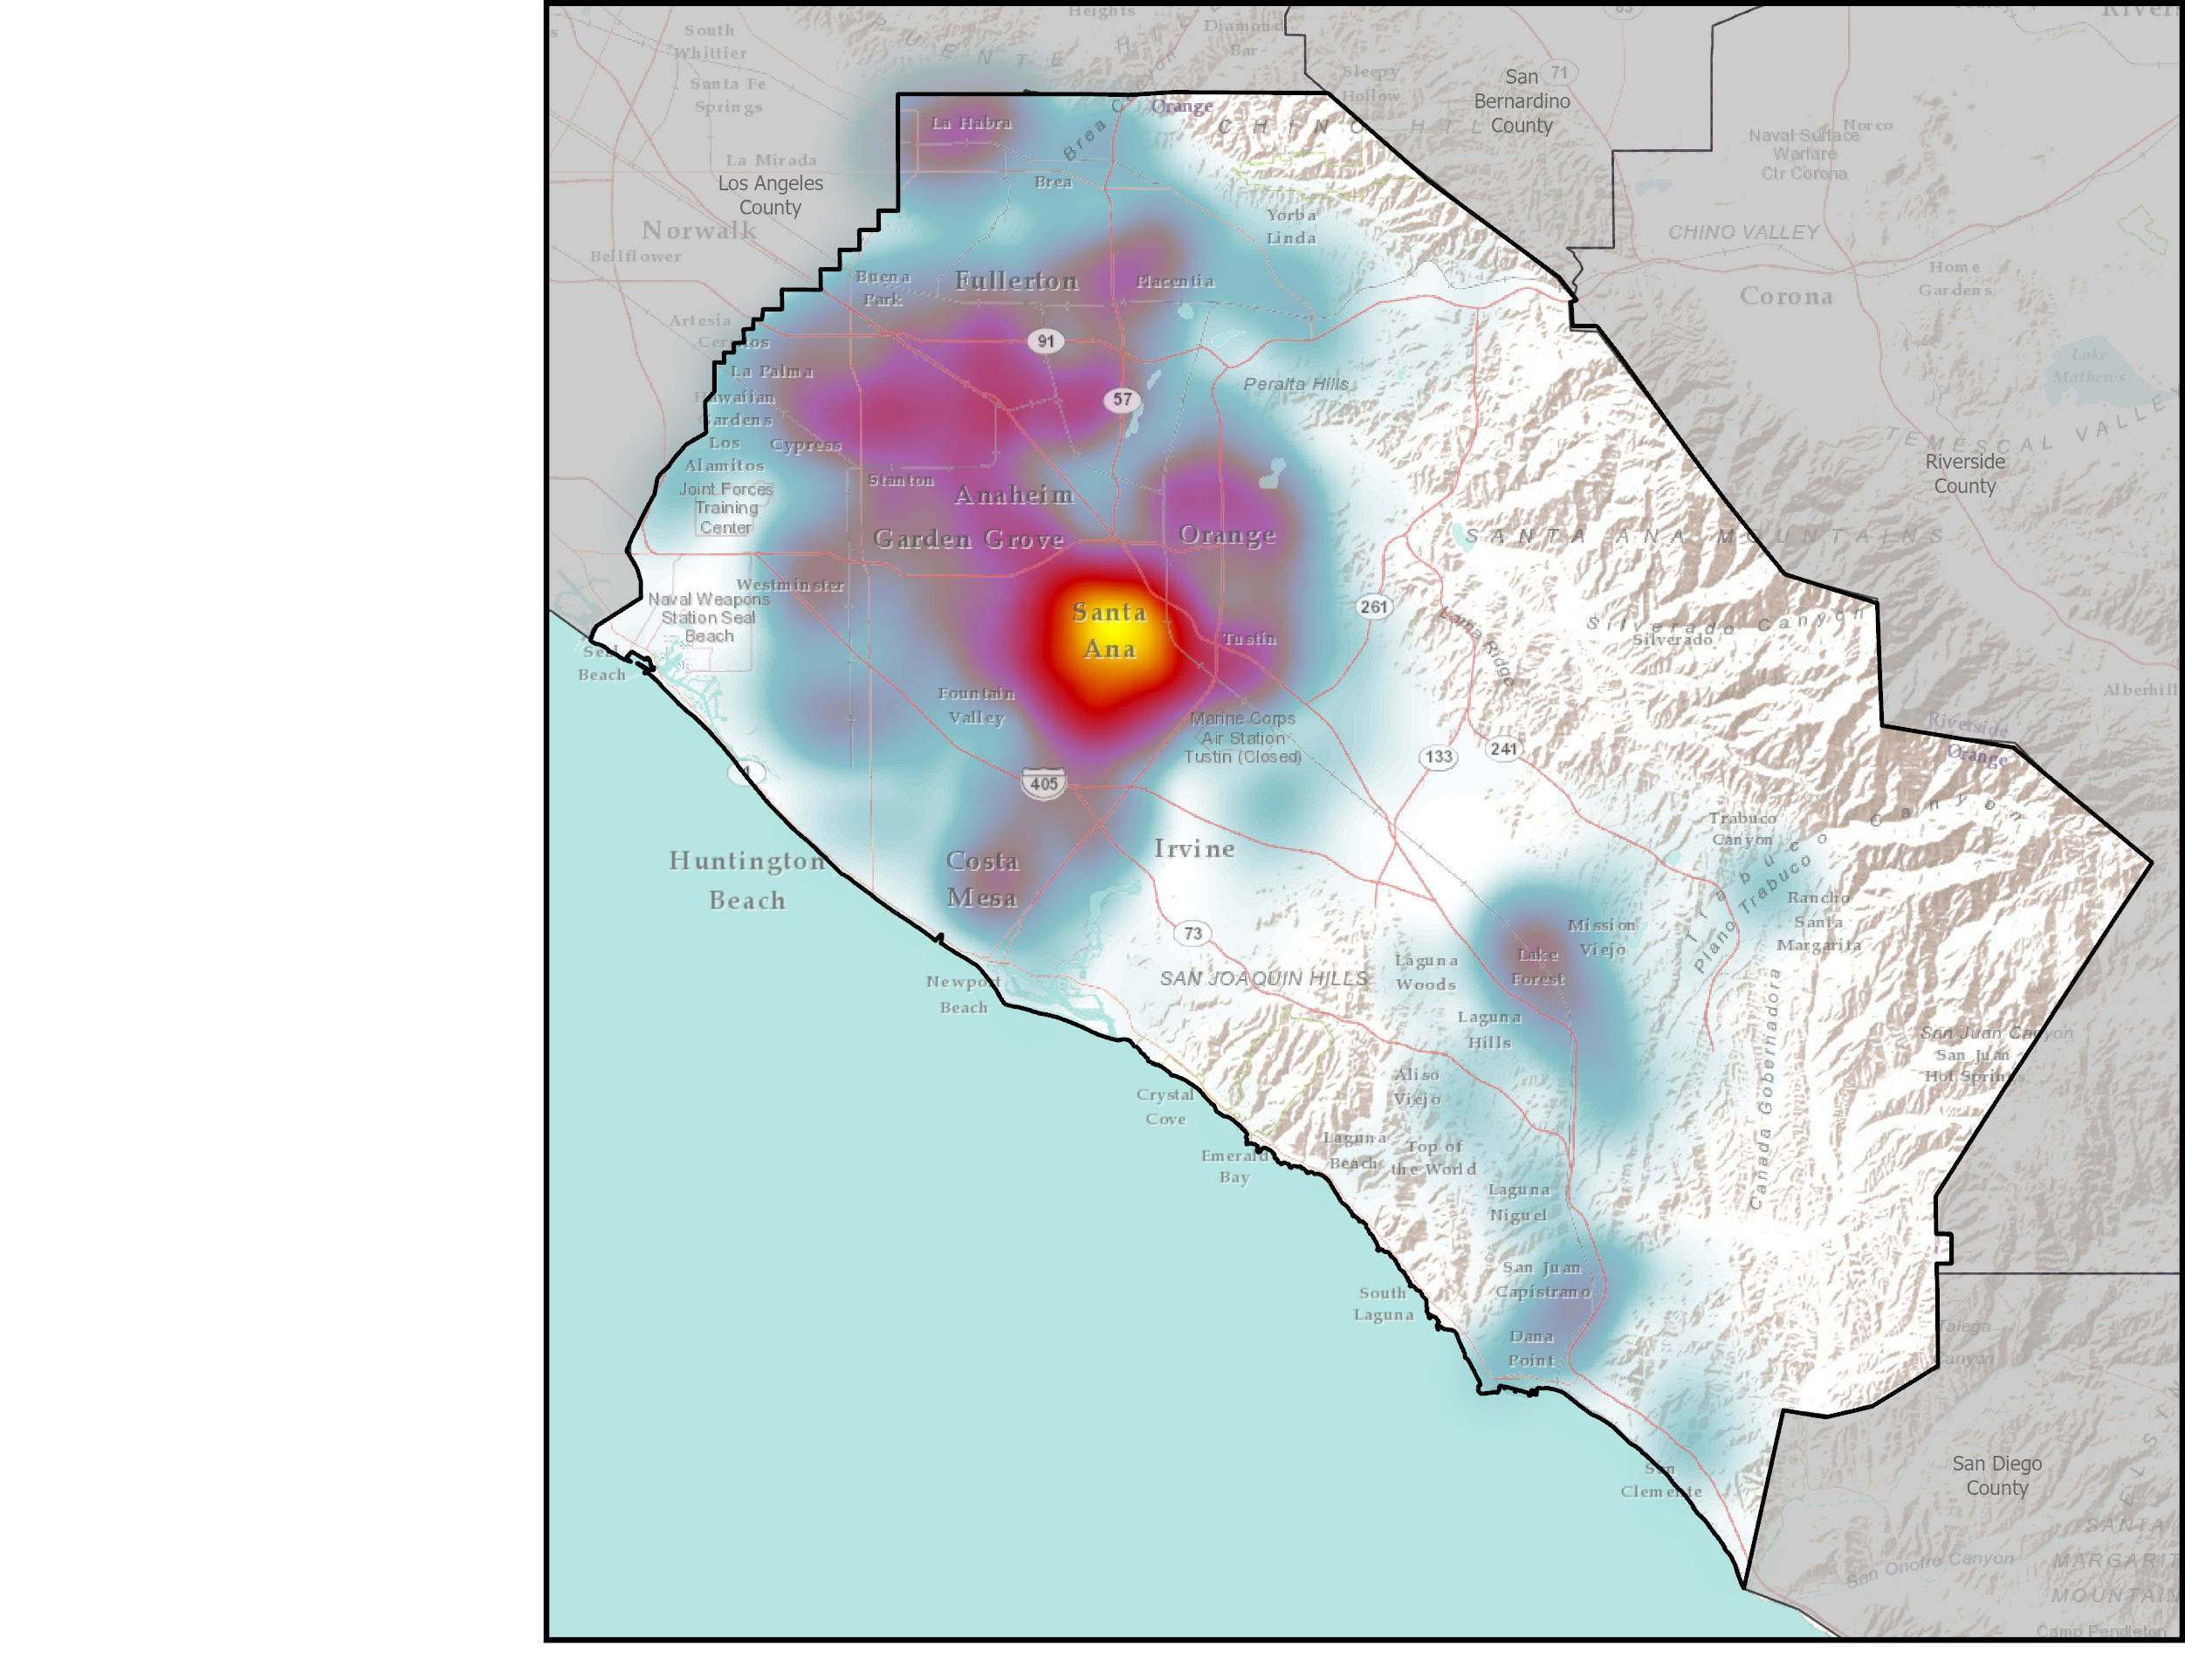
A Geographic Information System (GIS) map is a visualization tool that presents data geographically, allowing viewers to identify patterns that may otherwise appear random or unrelated. Whether static or interactive, these maps can:
Identify clusters, concentration, or “hot spots” of activity
Display the distribution or concentration of services or population characteristics
Be used to set priorities based on geographic areas of interest or need
Click here for some examples of what we have to offer.

